The American Clean Power Association (ACP) today released its Clean Power Quarterly Market Report – Q4 2022, which shows that the U.S. wind, solar, and battery storage sectors installed a total of 9.6 gigawatts (GW) of utility-scale clean power capacity last quarter – enough to power the equivalent of 2 million American homes with affordable, domestic energy.
While Q4 was the best quarter of 2022, it was the lowest fourth quarter for utility-scale clean energy project installations since 2019. A confluence of policy and market headwinds such as supply chain constraints, lengthy delays connecting projects to the grid, unclear trade restrictions, longstanding permitting obstacles and uncertainty over IRA implementation slowed project development in 2022. While ACP members have worked with federal, state and local officials to get over 25 GW of new clean power online, this progress fell short of industry and analyst projections.
“Affordable, American clean energy is on the rise, reducing both electric bills and pollution. But outdated regulations and unduly cumbersome permitting processes are slowing down the clean energy transition. These challenges are undermining progress across all energy technologies and must be addressed to create an energy system that is modern, reliable, clean and secure,” said Jason Grumet, ACP CEO.
Solar: Solar led wind and storage in quarterly installation capacity with 4.7 GW brought online in the last three months of the year. For the full year, solar installations totaled 12.6 GW – a slight decline compared to 2021 – and well short of the 30% growth expected for solar installs.
Storage: Battery storage had a record-breaking year: 4 GW were commissioned in 2022. This surpasses the previous record of 3 GW commissioned in 2021. Battery storage projects now make up 12% of the development pipeline.
Wind: Land-based wind ended the year with its strongest quarter, commissioning 4 GW of new projects. Despite this, the 8.5 GW installed in 2022 represents a 37% year-over-year drop. Notably, this was expected, largely due to the declining value of the Production Tax Credit available to wind.
The clean power development pipeline has reached a new high, thanks in part to the market’s reaction to the Inflation Reduction Act (IRA), with 13% more capacity in development queues since Q4 2021 and 135 GW of clean power projects in late stages of development.
However, in the first full quarter since the IRA went into effect, policy headwinds continue to put these landmark investments at risk and hold back the industry’s potential. The industry ended the year with the lowest fourth quarter since 2019, down 21% from 2021. Annual installations fell below both 2021 and 2020 levels, down 16% and 12% respectively.
A Record Year for Battery Storage
Battery storage had a record year in 2022, surpassing the 2021 record of 3 GW by commissioning 4 GW in 2022.
Cumulative operating battery storage capacity increased 80% in 2022 and now stands at 9 GW and 25 GWh.
Battery storage makes up 12% of the development pipeline.
Enough Clean Energy to Power 61 Million Homes
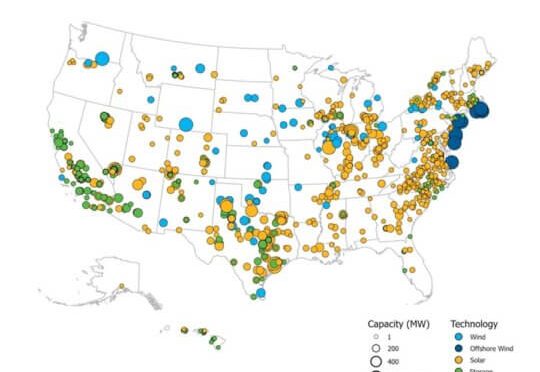
There is now 227 GW of operating clean power capacity in the United States.
This is enough capacity to power the equivalent of 61 million American homes, up from 59 million homes in Q3.
Texas and California Continue to Lead
Texas led installations with 9.2 GW installed in 2022, followed by California (4.7 GW), Oklahoma (1.5 GW), Florida (1.2 GW), and Nevada (0.9 GW).
Texas is the state with the most clean energy in development, representing 18% of the total development pipeline, followed by California (9%), New York (8%), Indiana (5%), and Virginia (5%).
Policy Headwinds Facing Solar and Wind
The industry finished the year with the lowest fourth quarter of installations since 2019, down 21% from 2021.
Annual installations fell below 2021 and 2020 levels, down 16% and 12%, respectively.
Strong Development Pipeline
The clean power project development pipeline has reached a new high, growing 13% since the fourth quarter of 2021.
Solar represents the largest share of the clean power pipeline, accounting for 59% of capacity, followed by land-based wind (15%), offshore wind (13%), and battery storage (12%).
At the end of the year, the near-term development pipeline consisted of 1,120 project phases totaling 135 GW of capacity, including 42 GW under construction and 93 GW in advanced development.
Clean power projects totaling 9.5 GW started construction and 8.2 GW entered advanced development in the fourth quarter.
Power Purchase Agreements Continue to Rise
Power purchasers and project developers announced 7.5 GW of new Power Purchase Agreements (PPAs) in the fourth quarter, bringing 2022 total contracting to 28.9 GW, just shy of the record year set in 2021 (29.9 GW).
Corporate customers are a growing source of clean power demand, outpacing utility announcements for the past two years and announcing a record 17 GW of new PPAs in 2022 after 4.6 GW were announced in the final quarter of the year. Across all offtake mechanisms, corporate buyers contracted more than 20 GW in 2022.
2022 announcements outpaced 2021 corporate PPA announcements by more than 20%.
Solar was the dominant technology for PPA announcements, accounting for over 75% of the capacity announced in 2022.