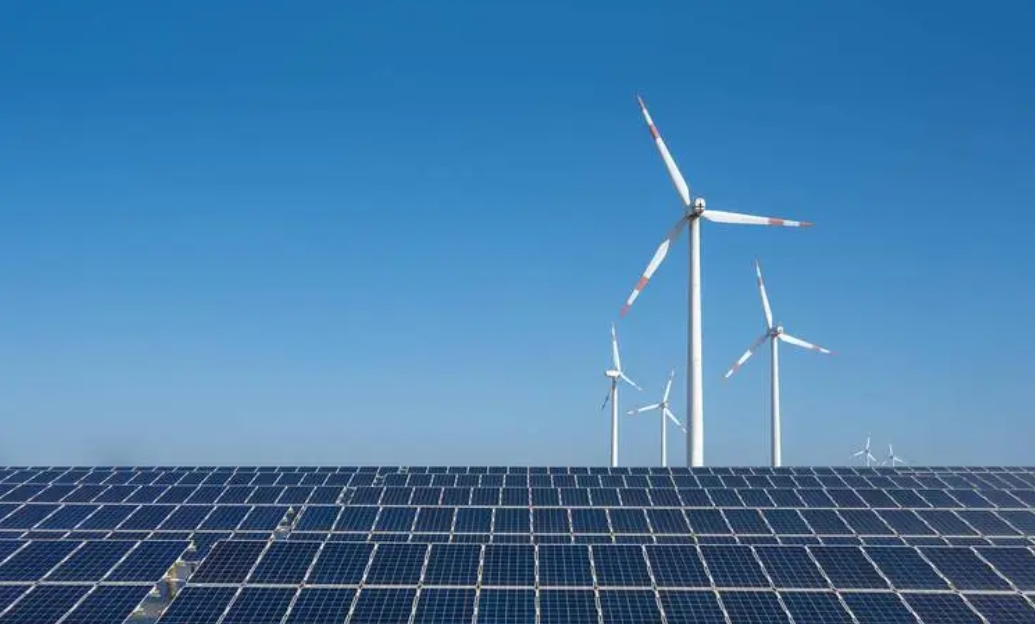
In its latest monthly "Energy Infrastructure Update" report (with data through August 31, 2023), FERC says solar provided 8,980 megawatts (MW) of new domestic generating capacity or 40.5% of the total. Solar capacity additions during the first two-thirds of this year were more than a third (35.9%) larger than for the same period last year.
Other renewable energy sources also saw growth this year. Wind provided an additional 2,761-MW (12.5%). With the inclusion of hydropower (224-MW), geothermal (44-MW), and biomass (30-MW), the mix of renewable energy sources accounted for the majority of new capacity additions – 54.3%.
The new solar capacity additions edged past those of natural gas (8,949-MW). Capacity was also provided by the new Vogtle-3 nuclear reactor (1,100-MW) in Georgia as well as by oil (32-MW) and waste heat (31-MW).
Thirty-six “units” of new solar came on-line in August alone, including the 148.7-MW BPL Files Solar Project in Hill County, Texas and the 100.0-MW Oak Trail Solar Project in Currituck County, North Carolina. These and other solar additions brought utility-scale (i.e., >1-MW) solar’s share of total available installed generating capacity in the U.S. up to 7.2%. [1] That still trails wind (11.6%) but is closing in on that of hydropower (8.0%). Taken together, the installed capacity of all renewable sources is now 28.3% of the total.
Solar’s strong growth during the first eight months of 2023 seems likely to continue. FERC reports that “high probability” additions of solar between September 2023 and August 2026 total 83,878-MW – an amount nearly four times the forecast net “high probability” additions for wind (21,453-MW) and over 20 times more than those projected for natural gas (4,037-MW).
And the numbers for solar may prove to be conservative. FERC also reports that there may actually be as much as 214,160-MW of new solar additions in the three-year pipeline.
If just the “high probability” additions materialize, by late summer 2026, solar will account for more than one-eighth (12.9%) of the nation’s installed generating capacity. That would be more than either wind (12.4%) or hydropower (7.5%). Solar’s installed generating capacity by August 2026 would also surpass of oil (2.6%) and nuclear power (7.5%) combined as well as approach that of coal (13.8%). [2]
In three years, natural gas would still comprise the largest share of installed generating capacity (41.7%) but the mix of all renewable sources (i.e., solar plus wind, hydropower, geothermal, and biomass) would total 34.2% and be on track to further reduce natural gas’ lead.
"Without interruption, each month solar energy increases its share of the U.S.’s electrical generating capacity," noted the SUN DAY Campaign's executive director Ken Bossong. "Now, fifty years after the onset of the 1973 Arab oil embargo, solar has grown from virtually nothing to a major part of the nation’s energy mix."
# # # # # # # # #
Source:
FERC's 8-page "Energy Infrastructure Update for August 2023" was released on October 12, 2023, and can be found at: https://cms.ferc.gov/media/energy-infrastructure-update-august-2023. For the information cited in this update, see the tables entitled "New Generation In-Service (New Build and Expansion)," "Total Available Installed Generating Capacity," and "Generation Capacity Additions and Retirements."
Notes:
[1] FERC generally only reports data for utility-scale facilities (i.e., those rated 1-MW or greater) and therefore its data do not reflect the capacity of distributed renewables, notably rooftop solar PV which - according to the U.S. Energy Information Administration (EIA) - accounted for approximately 31% of the nation's electrical generation by solar during the first seven months of 2023. That would imply that the total of distributed and utility-scale solar capacity combined is significantly more than the solar capacity of 7.21% reported by FERC at the end of the first eight months of 2023 and is perhaps closer to 10.0%.
[2] Generating capacity is not the same as actual generation. Fossil fuels and nuclear power generally have higher "capacity factors" than do wind and solar. For example, EIA reports capacity factors in 2022 for nuclear power and natural gas were 92.6% and 56.7% respectively while those for wind and solar were 36.1% and 24.8%.
# # # # # # # # #
The SUN DAY Campaign is a non-profit research and educational organization founded in 1992 to support a rapid transition to 100% reliance on sustainable energy technologies as a cost-effective alternative to nuclear power and fossil fuels and as a solution to climate change. Follow on Twitter (or “X”): @SunDayCampaign
