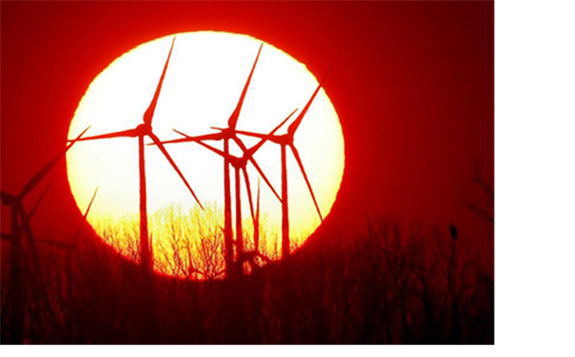
 Wind turbines turn in front of the setting sun in Biebesheim, some 50 km south of Frankfurt, Germany, Tuesday, Feb. 27, 2018.(AP Photo/Michael Probst) ASSOCIATED PRESS
•BP Warns Of An Unsustainable Path
•The U.S. Accounted For 98% Of Global Oil Production Growth In 2018
•Coal Demand Rises, But Remains Below Peak Levels
•U.S. Increases Its Dominance In Natural Gas Production
Today, I want to cover global trends in renewable energy.
Renewables
The Review separates renewables into two categories called Hydroelectric and Renewables. The former consists of hydropower, which has been around for a long time. Hydropower still produces more electricity globally than the Renewables category, which consists primarily of rapidly-growing wind and solar power, as well as more mature renewable technologies like geothermal power and power produced from biomass.
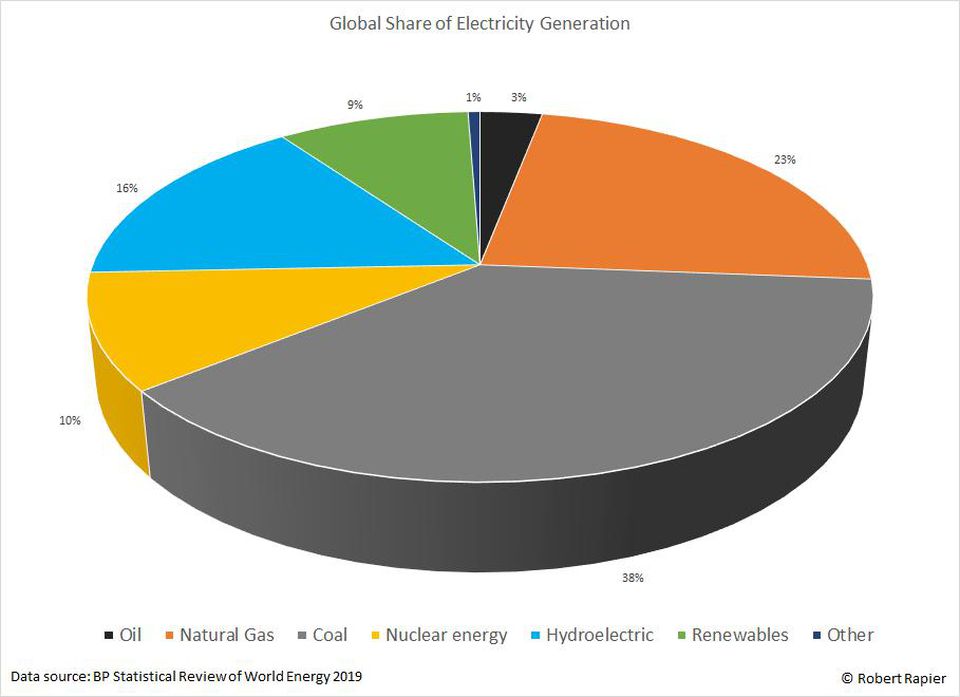
To put these numbers in perspective, the following graphic shows the global percentage each of the major power sources contributed to electricity generation in 2018:
 Global share of electricity production. ROBERT RAPIER
 Coal is still the dominant source of electricity around the world, although natural gas has taken over the top spot in the U.S. But, renewables have grown rapidly over the past decade, and are on the cusp of overtaking nuclear globally.
In 2018, nuclear power was responsible for 2,701 Terawatt-hours (TWh) of electricity generation, compared to 4,193 TWh for hydropower and 2,480 for renewables. In comparison, coal produced more power than all three categories combined.
However, the growth rates of the different categories of electricity generation tell a different story. Over the past decade, from 2007 to 2017, global electricity generated by coal grew at an annual average of 1.7%. Nuclear generation over that time actually declined annually by 0.4%, a consequence of the Fukushima Daiichi nuclear disaster in 2011. Hydropower generation grew at an average annual rate of 2.8%. These growth rates are indicative of mature power sources.
But contrast those growth rates with those of modern renewables.
From 2007 to 2017, the Renewables category grew at an average annual rate of 16.4%. But within that category, power from geothermal and biomass grew at an annual average of 7.1%. Wind and solar power, by contrast, grew at an annual average of 20.8% and 50.2%, respectively, over the past decade.
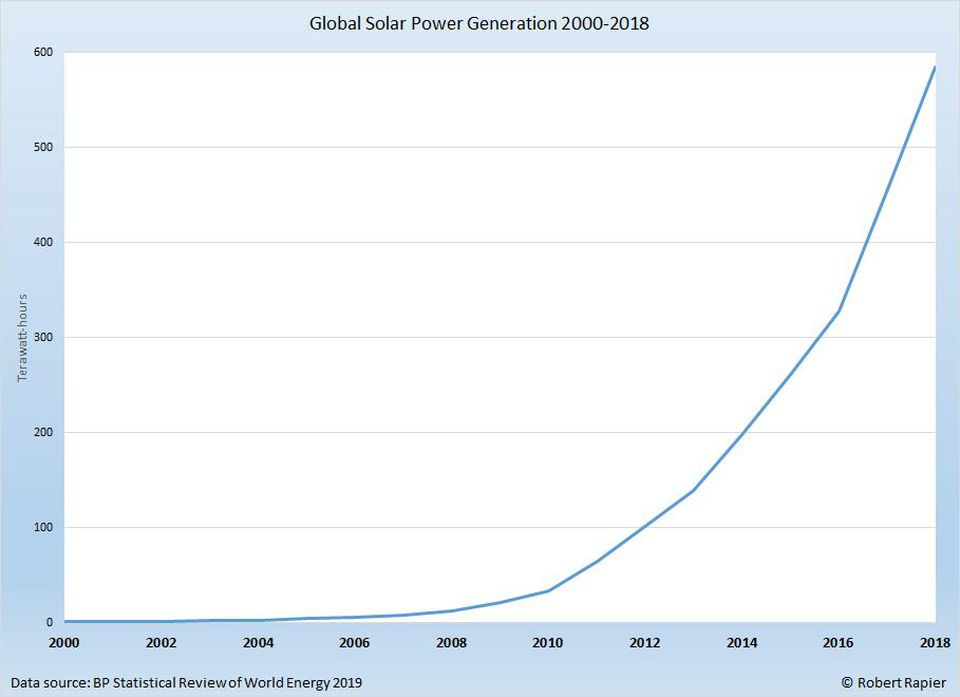
What does a 50% average annual growth rate over the past decade look like? Here are the global trends in solar power since 2000:
 Global solar power generation. ROBERT RAPIER
 (I will note that in 2007 I wrote an article called The Future is Solar, a few years before solar took off).
The world's leading producer of solar power in 2018 was once again China, with a 30.4% share globally. China maintained a blistering growth rate in 2018, with solar generation increasing by 50.7% over 2017. From 2007 to 2017, China increased solar generation at an average annual rate of just over 100%.
The U.S. remains in second place globally with a 16.6% share. U.S. solar power generation increased by 24.4% over 2017, and over the decade the U.S. has increased solar power at an average annual rate of 53.2%. Rounding out the Top 5 countries in solar power generation are Japan (12.3% share), Germany (7.9% share), and India (5.3% share).
Wind power is still ahead of solar in global electricity generation. In 2018, wind power was used to generate 1,270 TWh of power, versus 585 TWh for solar power. But solar power is on a trajectory to surpass wind power during the next decade.
Globally, China was also the top producer of wind power with a 28.8% global share. Again, the U.S. was second with a 21.9% share, followed by Germany (8.8% share), India (4.7% share), and the UK (4.5% share).
Nuclear power remains ahead of renewables, but just barely. Further, it is losing ground. In 2017, the world produced 22% more power from nuclear than it did from modern renewables. In 2018, the nuclear lead was less than 9%. Based on current trends, modern renewables will surpass nuclear power production either this year or next year. (I will add that nuclear is firm power, and renewables are intermittent, and that is an important distinction).
The rapid growth rate for renewables is a positive development in a world trying to rein in carbon dioxide emissions. However, renewables have not yet reached a level at which they are actually causing fossil fuel demand to contract.
Modern renewable energy consumption (mainly wind and solar power) grew by 71 million metric tons of oil equivalent in 2018. But global energy consumption grew much faster than that, with fossil fuels carrying most of the load. Global consumption of coal, oil, and natural gas grew by 276 million metric tons in 2018, nearly four times the growth in renewables. As a result, global carbon dioxide emissions set a new all-time high in 2018.
This highlights the need to continue developing low-carbon sources of firm power that can be operated at large scale. The most obvious candidate is nuclear power, which will be covered in the next article.